Taiwan’s Inbound Travel Market
Visitors to Taiwan
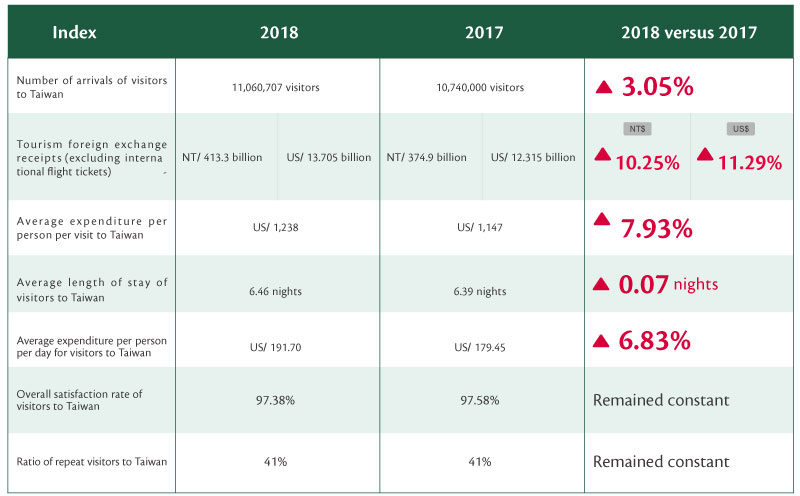
Taiwan attracted a record 11,060,707 inbound visitors in 2018, up 327,106 visits or 3.05% from 2017.
Key Indicators of Taiwan’s Inbound Tourism Market in 2018
| Index | 2018 | 2017 | 2018 versus 2017 | |||
|---|---|---|---|---|---|---|
| Number of arrivals of visitors to Taiwan | 11,060,707 visitors | 10,740,000 visitors | 3.05% | |||
| Tourism foreign exchange receipts (excluding international flight tickets) | NT$413.3 billion | US$13.705 billion | NT$374.9 billion | US$12.315 billion |
NT$
10.25%
|
US$
11.29%
|
| Average expenditure per person per visit to Taiwan | US$1,238 | US$1,147 | 7.93% | |||
| Average length of stay of visitors to Taiwan | 6.46 nights | 6.39 nights | 0.07 nights | |||
| Average expenditure per person per day for visitors to Taiwan | US$191.70 | US$179.45 | 6.83% | |||
| Overall satisfaction rate of visitors to Taiwan | 97.38% | 97.58% | Remained constant | |||
| Ratio of repeat visitors to Taiwan | 41% | 41% | Remained constant | |||


Taiwan’s Major Tourism Source Markets in 2018
In 2018, visitor arrivals increased from all major source markets except for China, Hong Kong-Macau, and South Korea. Southeast Asia was the fastest growing source market. Australia-New Zealand and Europe ranked second and third, respectively


According to the findings of the Tourism Bureau’s R.O.C 2018 Survey Report on the Consumption and Activity of Visitors to Taiwan, 40% of visitors requested travel agencies to arrange accommodation (and/or book flights), 38% did not request local travel agencies to arrange or book accommodations and flights and after arriving did not request local travel agencies to arrange any itineraries, and 19% joined package tours arranged by travel agencies.
The main attractions that drew visitors to Taiwan were “fine food or specialty snacks” and “scenic landscapes,” and their main activities in Taiwan were shopping, going to night markets, and visiting historic sites. Visitors’ deepest impressions of Taiwan were from the cuisine, scenic spots, and friendly people.
Major Tourist Attractions for Inbound Visitors
The main tourist spots visited were night markets, Taipei 101, and Ximending; the places they visited and liked the best were Kenting National Park, Jiufen, and Sun Moon Lake.
Spending by Inbound Visitors to Taiwan in 2018
In 2018, the average spending by visitors to Taiwan increased by 6.83% to US$191.70 per person per day. Foreign exchange earnings from tourism for the year are estimated to have been US$13.705 billion (up 11.29%), while earnings denominated in New Taiwan dollars rose by 10.25% to NT$413.3 billion.
Domestic Travel
Major Indices of R.O.C. Citizens’ Domestic Tourism Trips in 2018
| Items | 2018 | 2017 | 2018 versus 2017 | |||
|---|---|---|---|---|---|---|
| Ratio of citizens who took domestic tourism trips | 91.2% | 91.0% | Up +0.2 percentage points | |||
| Average number of trips per person | 8.09 trips | 8.70 trips | 0.61trips | |||
| Total number of citizens’ domestic tourism trips | 171,090,000 trips | 183,449,000 trips | 6.74% | |||
| Average length of stay per trip | 1.49 days | 1.49 days | Remained constant | |||
| Percentage who took tourism trips on holidays | 68.2% | 69.4% | 1.2 percentage points | |||
| Overall level of satisfac- tion with tourism trips | 98.0% | 97.5% | 0.5 percentage points | |||
| Average spending per person per tourism trip | NT$2,203 | US$72.99 | NT$2,192 | US$71.90 |
NT$
0.5%
|
US$
1.52%
|
| R.O.C. citizens’ total spending on domestic tourism trips | NT$376.9 billion | US$12.487 billion | NT$402.1 billion | US$13.19 billion |
NT$
6.27%
|
US$
5.33%
|
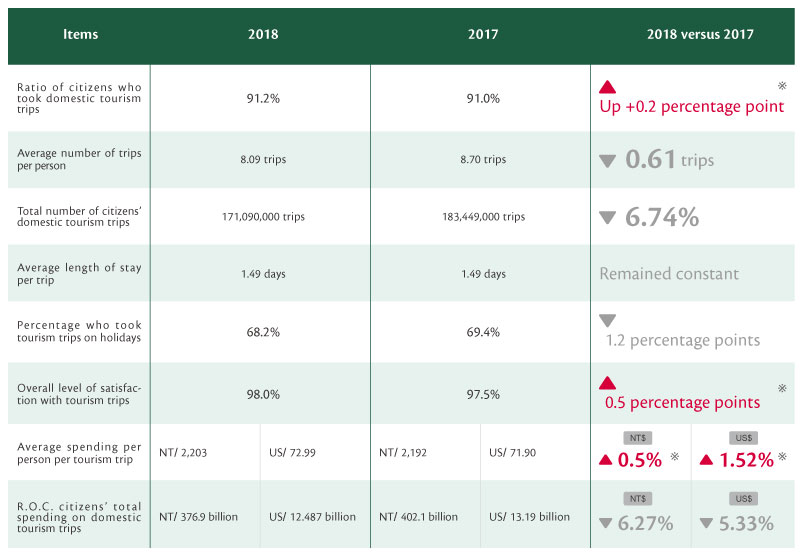
- The survey was conducted on citizens aged 12 and above.
- “※” symbol indicates that the significance level was under 5% and shown by t-test to not be a significant difference.
- The ratio of citizens who took domestic tourism trips refers to the percentage of the whole population who took at least one domestic tourism trip during the whole year.
- The average tourism trip spending per person per day = the average consumption spending per person per trip ÷ the average length of stay (days) per person per trip. ism trip during the whole year.
According to the findings of the “2018 Survey of Travel by ROC Citizens,” ROC citizens made 171.09 million domestic trips in 2018 (down 6.74%). Growth was flat in the first half of the year, as cheap flights encouraged overseas trips and domestic travel was impacted by he Hualien earthquake. Domestic travel in the second half of the year fell by 13% due to global economic weakness, pension reforms in July, and torrential rains in August.
Of the total number of domestic trips, 68% were weekend or holiday trips and 32% were weekday trips. About 88.9% of the domestic trips were self-planned, while tour agency arranged package tours accounting for 1.4%, and school, government, company, village, and other group travel contributed 9.7%. The main factors considered in choice of destinations were, in order of importance, ease of travel, special events, curiosity to visit an unfamiliar place, and quality of food.
In 2018, average spending per person per tourism trip was NT$2,203 (up 0.5%). Spending on domestic tourism trips for the entire year is estimated at NT$376.9 billion (down 6.27%).
Visitor Trends at Major Tourism Attractions
Since 2001, the Tourism Bureau has collected statistics from subsidiary units on the number of visitors at major tourism and recreation attractions to understand visitor trends at these attractions as a reference for policy planning.
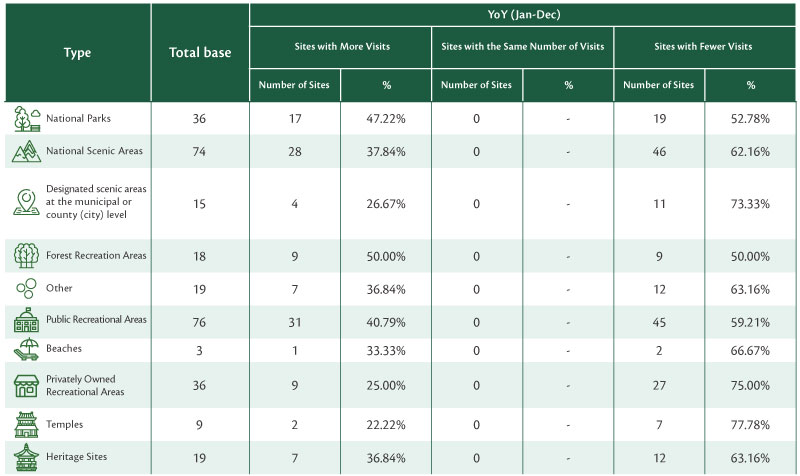
In terms of attraction type, half of the forest recreation areas saw an increase in number of visitors over 2017. Visitor numbers increased in more than 40% of the sites in the categories of national parks and public recreation areas, while the number of visitors to most temples fell from the year before. Among the 305 sites compared between 2018 and 2017, visitor declines were larger at principal scenic sites in southern and eastern Taiwan. Nearly half of the sites in northern Taiwan and outlying regions saw increases.
Number of Major Tourism and Recreation Sites (2018)
| Type | Number of Sites | |||||
|---|---|---|---|---|---|---|
| By Area (2018) | By year | |||||
| North | Central | South | East | Outlying Island | 2018 | |
| 9 | 5 | 9 | 4 | 9 | 36 | |
| 23 | 6 | 20 | 16 | 11 | 76 | |
| 8 | 3 | 3 | 1 | 0 | 15 | |
| 6 | 6 | 3 | 3 | 0 | 18 | |
| 1 | 0 | 2 | 0 | 0 | 3 | |
| 39 | 15 | 16 | 5 | 1 | 76 | |
| 20 | 6 | 7 | 2 | 1 | 36 | |
| 10 | 3 | 7 | 0 | 0 | 20 | |
| 2 | 3 | 4 | 0 | 0 | 9 | |
| 11 | 4 | 6 | 2 | 1 | 24 | |
| 129 | 47 | 77 | 33 | 23 | 313 | |
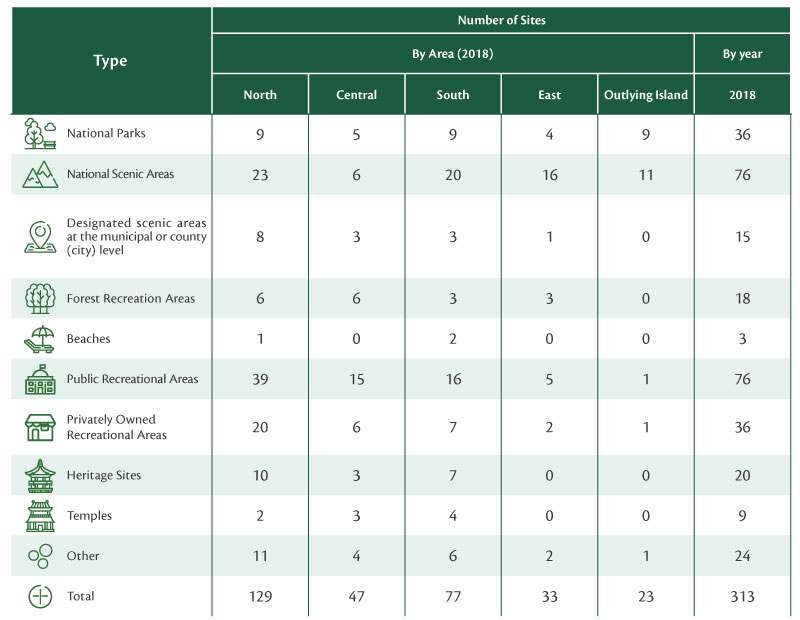
- Northern Taiwan:Yilan County、Keelung City、Taipei City、New Taipei City、Taoyuan City、Hsinchu City、Hsinchu County、Miaoli County
- Central Taiwan:Taichung City、Changhua County、Nantou County
- Southern Taiwan:Yunlin County、Chiayi City、Chiayi County、Tainan City、Kaohsiung City、Pingtung County
- Eastern Taiwan:Hualien County、Taitung County
- Outlying Islands:Lienchiang County、Kinmen County、Penghu County
Visitor Trends at Major Tourism and Recreation Attractions in Taiwan in 2018 tions in Taiwan in 2018
| Type | Total base | YoY (Jan-Dec) | |||||
|---|---|---|---|---|---|---|---|
| Sites with More Visits | Sites with the Same Number of Visits | Sites with Fewer Visits | |||||
| Number of Sites | % | Number of Sites | % | Number of Sites | % | ||
| 36 | 17 | 47.22% | 0 | - | 19 | 52.78% | |
| 74 | 28 | 37.84% | 0 | - | 46 | 62.16% | |
| 15 | 4 | 26.67% | 0 | - | 11 | 73.33% | |
| 18 | 9 | 50.00% | 0 | - | 9 | 50.00% | |
| 19 | 7 | 36.84% | 0 | - | 12 | 63.16% | |
| 76 | 31 | 40.79% | 0 | - | 45 | 59.21% | |
| 3 | 1 | 33.33% | 0 | - | 2 | 66.67% | |
| 36 | 9 | 25.00% | 0 | - | 27 | 75.00% | |
| 9 | 2 | 22.22% | 0 | - | 7 | 77.78% | |
| 19 | 7 | 36.84% | 0 | - | 12 | 63.16% | |
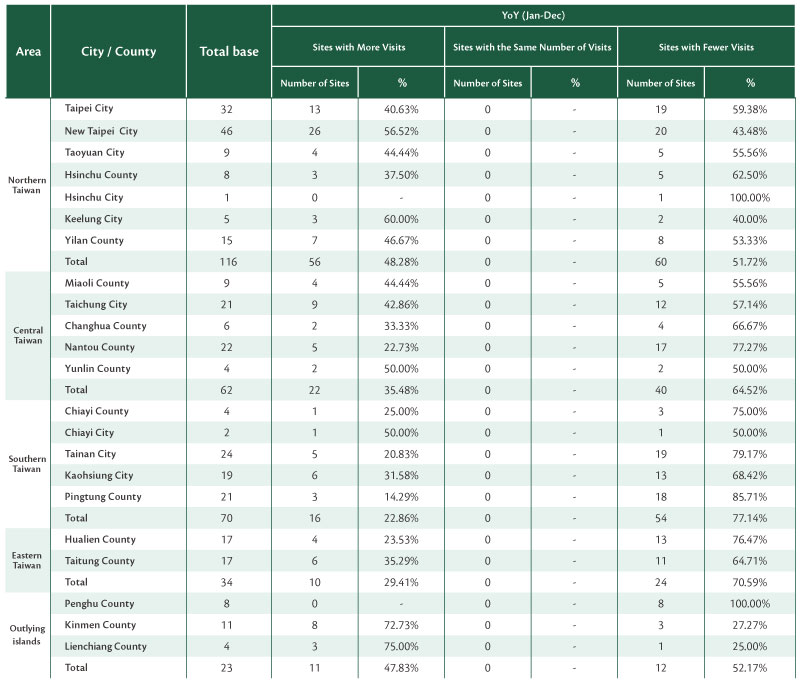
Visitor Trends at Major Tourism and Recreation Attractions in Taiwan by County/City in 2018
| Area | City / Count | Total base | YoY (Jan-Dec) | |||||
|---|---|---|---|---|---|---|---|---|
| Sites with More Visits | Sites with the Same Number of Visits | Sites with Fewer Visits | ||||||
| Number of Sites | % | Number of Sites | % | Number of Sites | % | |||
| Northern Taiwan | Taipei City | 32 | 13 | 40.63% | 0 | - | 19 | 59.38% |
| New Taipei City | 46 | 26 | 56.52% | 0 | - | 20 | 43.48% | |
| Taoyuan City | 9 | 4 | 44.44% | 0 | - | 5 | 55.56% | |
| Hsinchu County | 8 | 3 | 37.50% | 0 | - | 5 | 62.50% | |
| Hsinchu City | 1 | 0 | - | 0 | - | 1 | 100.00% | |
| Keelung City | 5 | 3 | 60.00% | 0 | - | 2 | 40.00% | |
| Yilan Count | 15 | 7 | 46.67% | 0 | - | 8 | 53.33% | |
| Total | 116 | 56 | 48.28% | 0 | - | 60 | 51.72% | |
| Central Taiwan | Miaoli County | 9 | 4 | 44.44% | 0 | - | 5 | 55.56% |
| Taichung City | 21 | 9 | 42.86% | 0 | - | 12 | 57.14% | |
| Changhua County | 6 | 2 | 33.33% | 0 | - | 4 | 66.67% | |
| Nantou County | 22 | 5 | 22.73% | 0 | - | 17 | 77.27% | |
| Yunlin County | 4 | 2 | 50.00% | 0 | - | 2 | 50.00% | |
| Total | 62 | 22 | 35.48% | 0 | - | 40 | 64.52% | |
| Southern Taiwan | Chiayi County | 4 | 1 | 25.00% | 0 | - | 3 | 75.00% |
| Chiayi City | 2 | 1 | 50.00% | 0 | - | 1 | 50.00% | |
| Tainan City | 24 | 5 | 20.83% | 0 | - | 19 | 79.17% | |
| Kaohsiung City | 19 | 6 | 31.58% | 0 | - | 13 | 68.42% | |
| Pingtung County | 21 | 3 | 14.29% | 0 | - | 18 | 85.71% | |
| Total | 70 | 16 | 22.86% | 0 | - | 54 | 77.14% | |
| Eastern Taiwan | Hualien County | 17 | 4 | 23.53% | 0 | - | 13 | 76.47% |
| Taitung County | 17 | 6 | 35.29% | 0 | - | 11 | 64.71% | |
| Total | 34 | 10 | 29.41% | 0 | - | 24 | 70.59% | |
| Outlying islands | Penghu County | 8 | 0 | - | 0 | - | 8 | 100% |
| Kinmen County | 11 | 8 | 72.73% | 0 | - | 3 | 27.27% | |
| Lienchiang County | 4 | 3 | 75.00% | 0 | - | 1 | 25.00% | |
| Total | 23 | 11 | 47.83% | 0 | - | 12 | 52.1% | |