The Global Travel Market
According to the World Tourism Organization, global international travel hit a record high in 2018. Taiwan joined the boom, attracting more than 11 inbound visitors that year, writing a proud new page in the tourism sector. The Tourism Bureau also continued to develop more tourism markets, such as South Korea, Malaysia, and Europe to create a more diversified and sustainable tourism environment in Taiwan.
Overview of the Global Tourism Market
In 2018, the number of international visits worldwide rose by 6% to 1.4 billion, the second-fastest pace since 2010 and second only to 2017 (+7%). The fastest growing regions for international travel in 2018 were the Middle East (up 10%) and Africa (up 7%). Asia and Europe followed with a 6% gain (on par with the global average), while the Americas rose by 3%.
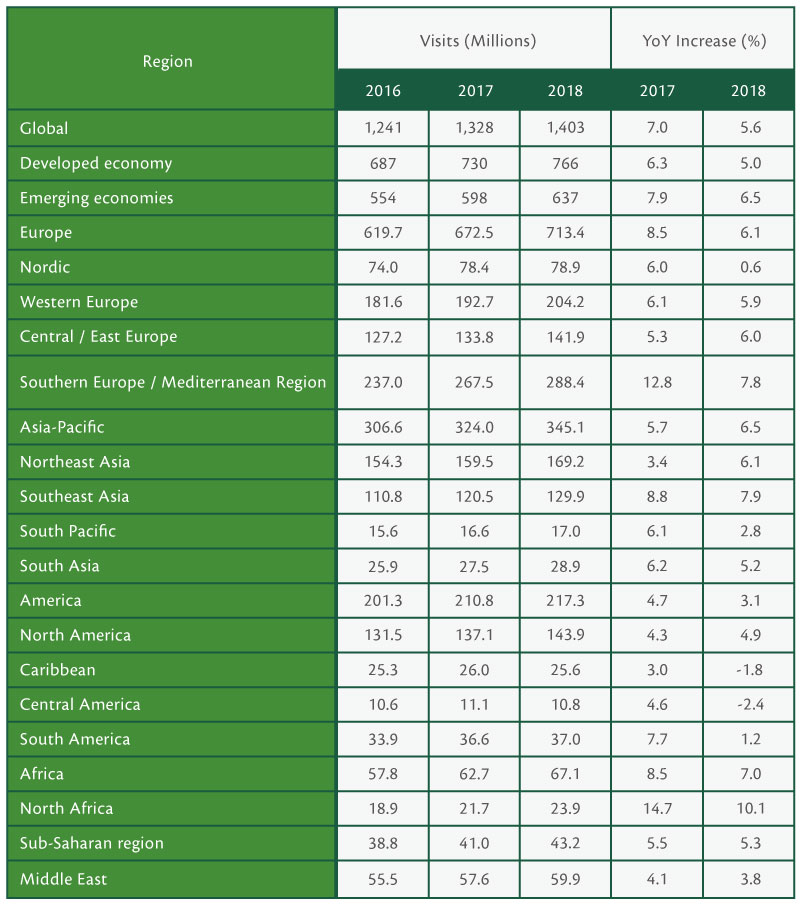
Statistics on International Tourism Markets for Inbound Visitors
| Region | Visits (Millions) | YoY Increase (%) | |||
|---|---|---|---|---|---|
| 2016 | 2017 | 2018 | 2017 | 2018 | |
| Global | 1,241 | 1,328 | 1,403 | 7.0 | 5.6 |
| Developed economy | 687 | 730 | 766 | 6.3 | 5.0 |
| Emerging economies | 554 | 598 | 637 | 7.9 | 6.5 |
| Europe | 619.7 | 672.5 | 713.4 | 8.5 | 6.1 |
| Nordic | 74.0 | 78.4 | 78.9 | 6.0 | 0.6 |
| Western Europe | 181.6 | 192.7 | 204.2 | 6.1 | 5.9 |
| Central / East Europe | 127.2 | 133.8 | 141.9 | 5.3 | 6.0 |
| Southern Europe / Mediterranean Region | 237.0 | 267.5 | 288.4 | 12.8 | 7.8 |
| Asia-Pacific | 306.6 | 324.0 | 345.1 | 5.7 | 6.5 |
| Northeast Asia | 154.3 | 159.5 | 169.2 | 3.4 | 6.1 |
| Southeast Asia | 110.8 | 120.5 | 129.9 | 8.8 | 7.9 |
| South Pacific | 15.6 | 16.6 | 17.0 | 6.1 | 2.8 |
| South Asia | 25.9 | 27.5 | 28.9 | 6.2 | 5.2 |
| America | 201.3 | 210.8 | 217.3 | 4.7 | 3.1 |
| North America | 131.5 | 137.1 | 143.9 | 4.3 | 4.9 |
| Caribbean | 25.3 | 26.0 | 25.6 | 3.0 | -1.8 |
| Central America | 10.6 | 11.1 | 10.8 | 4.6 | -2.4 |
| South America | 33.9 | 36.6 | 37.0 | 7.7 | 1.2 |
| Africa | 57.8 | 62.7 | 67.1 | 8.5 | 7.0 |
| North Africa | 18.9 | 21.7 | 23.9 | 14.7 | 10.1 |
| Sub-Saharan region | 38.8 | 41.0 | 43.2 | 5.5 | 5.3 |
| Middle East | 55.5 | 57.6 | 59.9 | 4.1 | 3.8 |
Overview of Asian Tourism Markets
In 2018, South Korea was the fastest growing visitor destination in Asia in terms of number of visitor arrivals, growing at 15.1%. It was followed by Hong Kong at 11.4%. Taiwan was a major visitor source for the tourism markets of Hong Kong, Japan, and South Korea. It also maintained close exchanges throughout Asia.
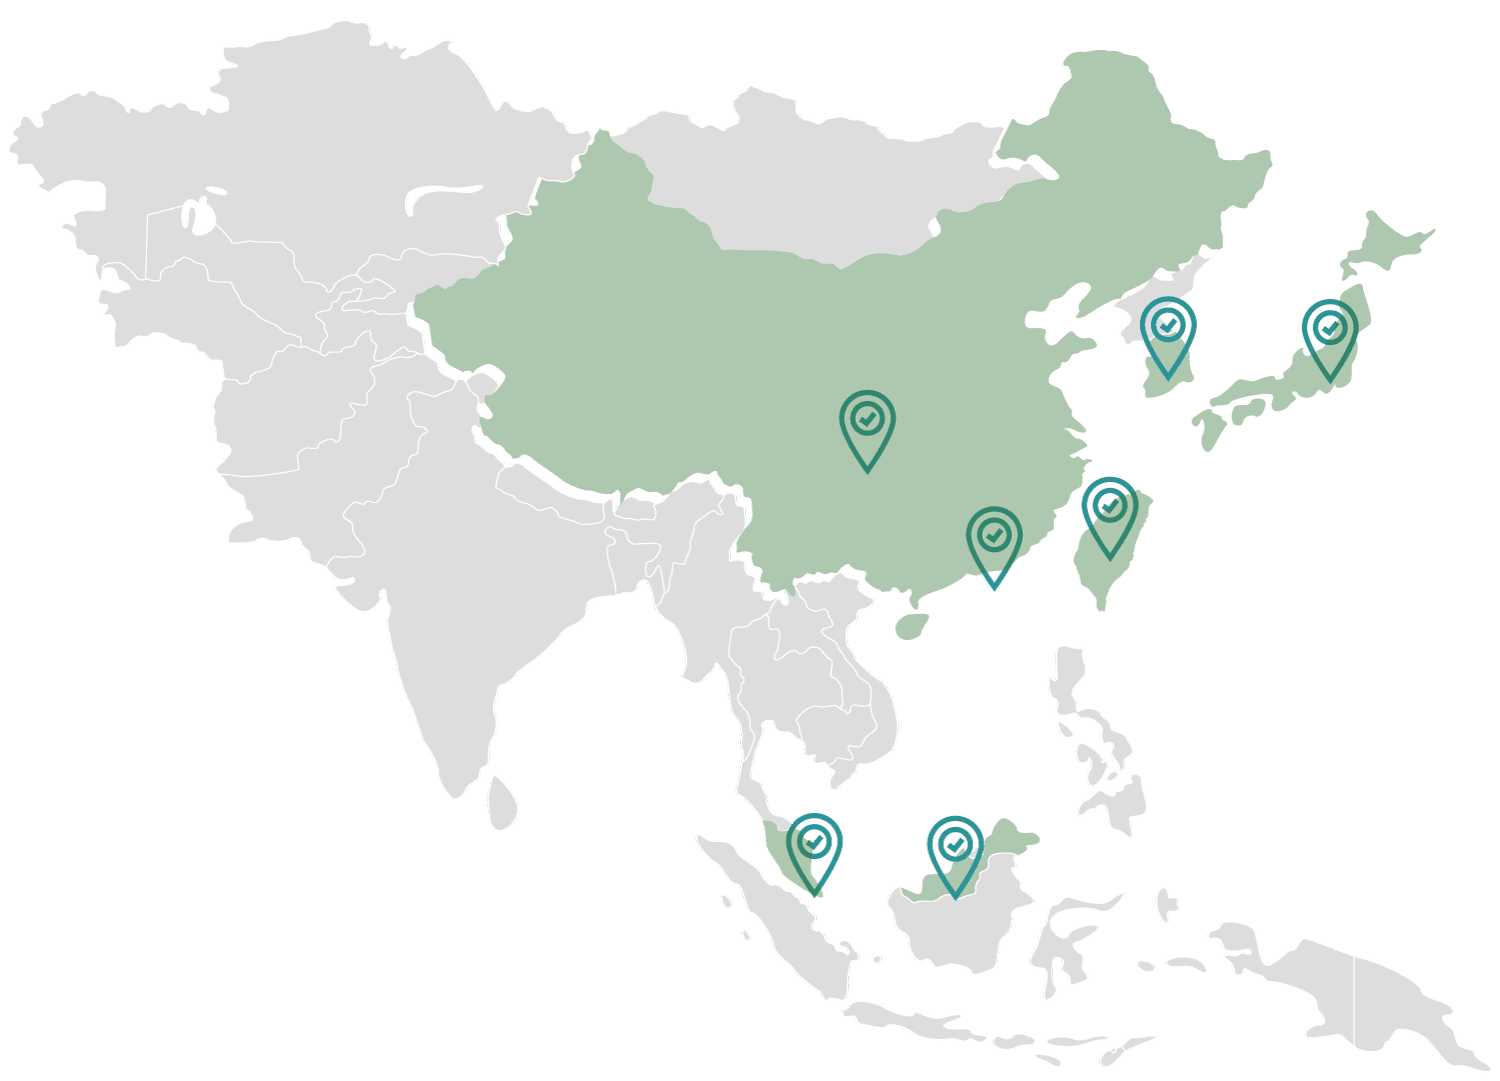
Number of Inbound Visitors in Asian Tourism Markets in 2018
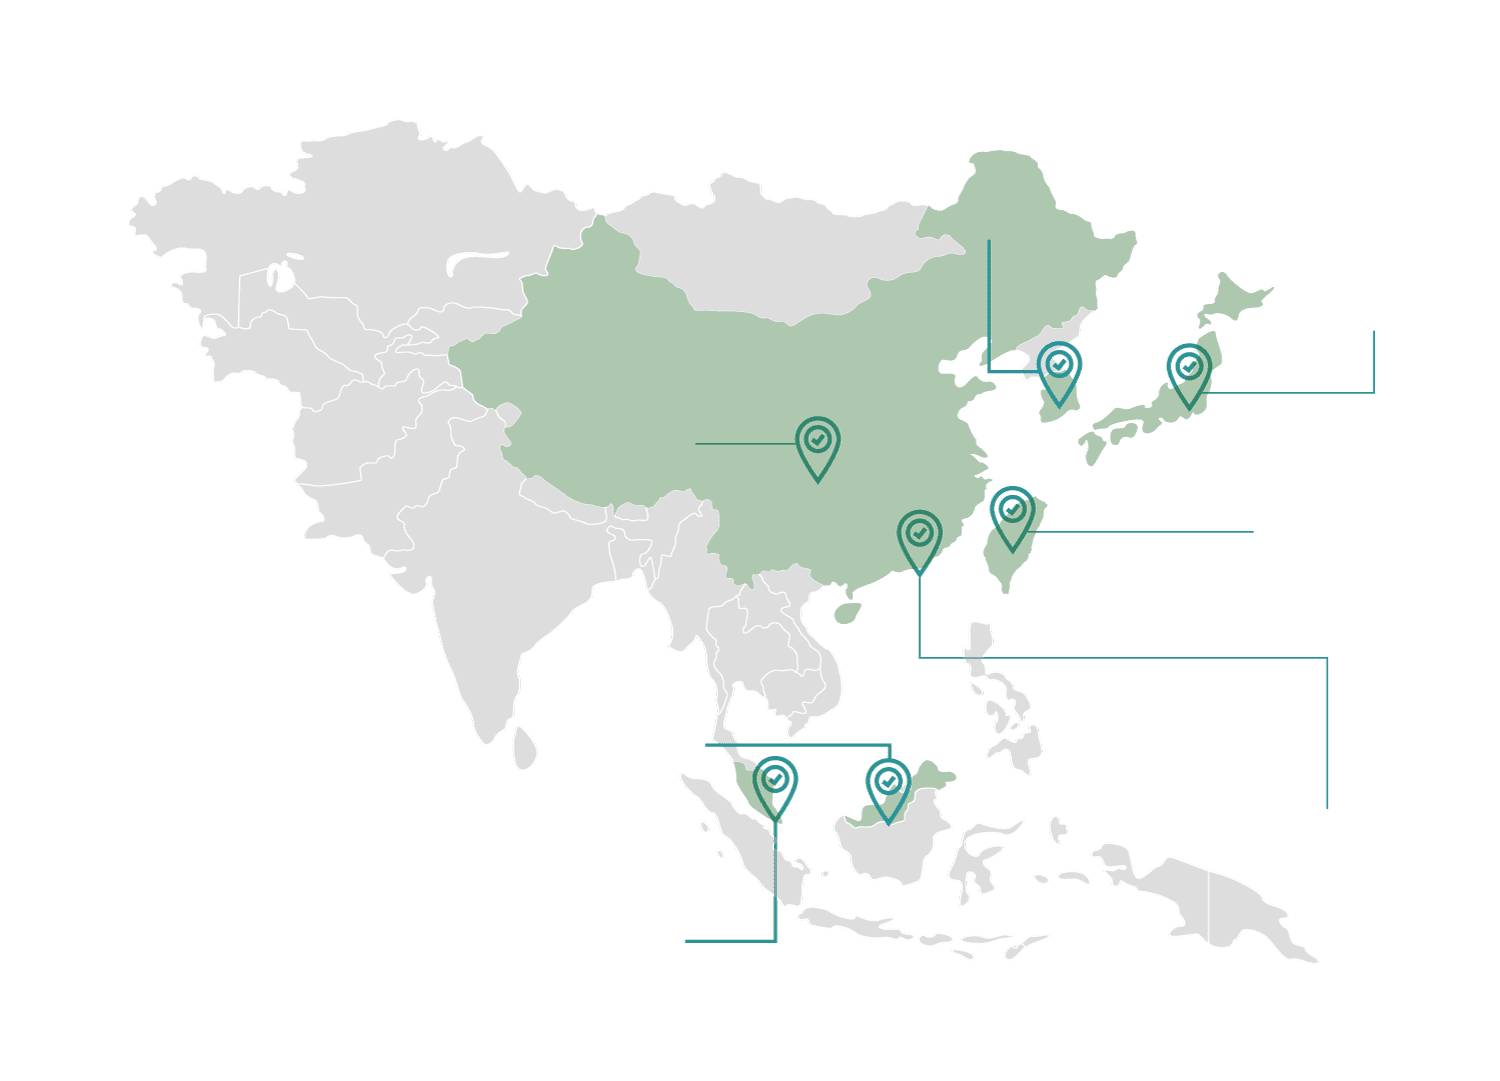
Japan
31,191,856 visitors
South Korea
15,346,879 visitors
Taiwan
11,066,707 visitors
Hong Kong
65,147,555 visitors
China
141,120,000 visitors
Malaysia
25,832,354 visitors
Singapore
18,506,619 visitors
Japan
31,191,856 visitors
South Korea
15,346,879 visitors
Taiwan
Hong Kong
65,147,555 visitors
China
141,120,000 visitors
Malaysia
25,832,354 visitors
Singapore
18,506,619 visitors
