Taiwan Travel Market
Visitors to Taiwan
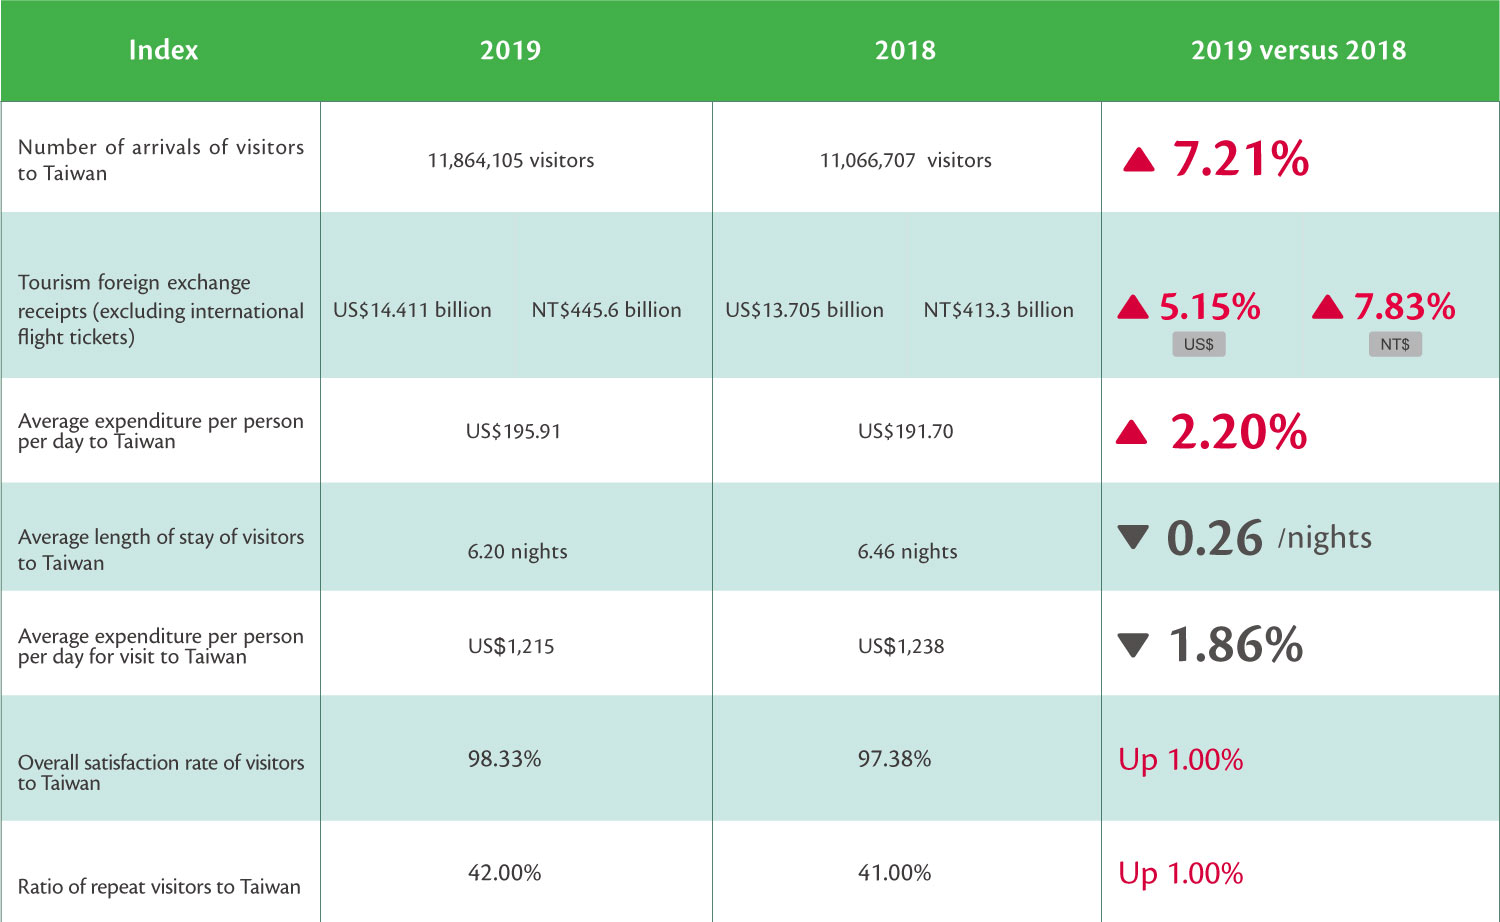
Taiwan attracted a record 11,864,105 inbound visitors in 2019, up 797,398 visits or 7.21% from 2018.
Key Indicators of Taiwan's Inbound Tourism Market in 2019

Taiwan's Major Tourism Source Markets in 2019
In 2019, visitor arrivals increased from all major source markets.South Korea was the fastest growing source market.


According to the findings of the Tourism Bureau’s R.O.C 2019 Survey Report on the Consumption and Activity of Visitors to Taiwan, 46% of visitors requested travel agencies to arrange accommodation (and/or book flights), 32% did not request local travel agencies to arrange or book accommodations and flights and after arriving did not request local travel agencies to arrange any itineraries, and 18% joined package tours arranged by travel agencies.
The main attractions that drew visitors to Taiwan were "fine food or specialty snacks" and "scenic landscapes," and their main activities in Taiwan were shopping, going to night markets, and visiting historic sites. Visitors' deepest impressions of Taiwan were from the cuisine, scenic spots, and going to night markets.
The main tourist spots visited were night markets, Taipei 101, and Ximending; the places they visited and liked the best were Kenting National Park, Jiufen, and Sun Moon Lake.
In 2019, the average spending by visitors to Taiwan increased by 2.20% to US$195.91 per person per day. Foreign exchange earnings from tourism for the year are estimated to have been US$14.411 billion (up 5.15%), while earnings denominated in New Taiwan dollars rose by 7.83% to NT$445.6 billion.
Domestic Travel
Major Indices of R.O.C. Citizens’Domestic Travel
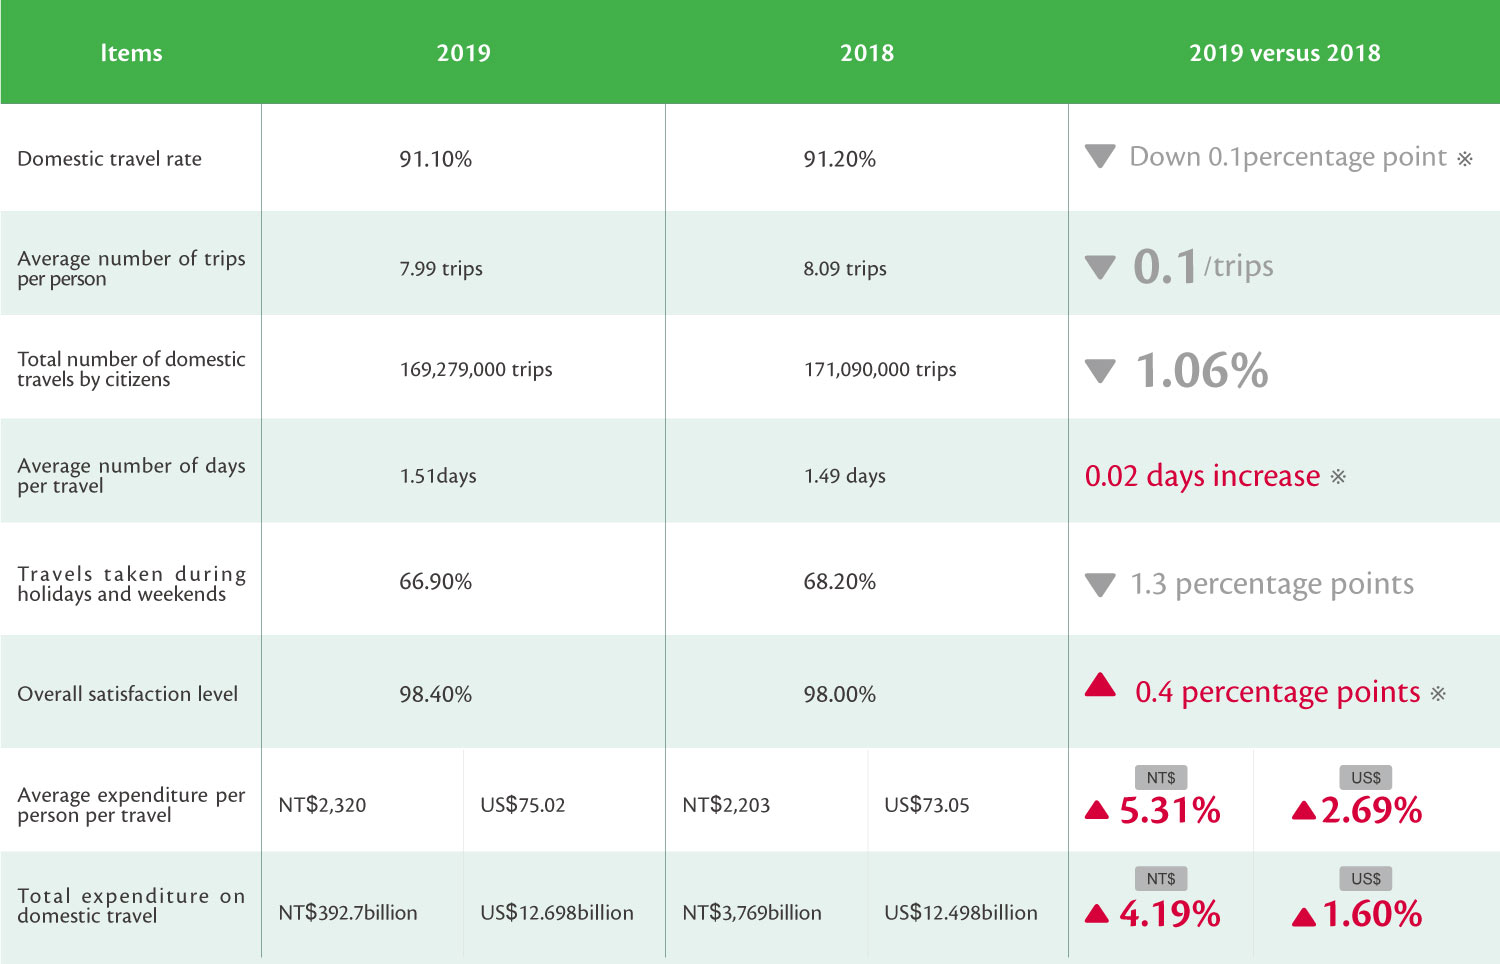
- 1.The survey was conducted on citizens aged 12 and above.
- 2."※" symbol indicates that the significance level was under 5% and shown by t-test to not be a significant difference.
- 3.The ratio of citizens who took domestic tourism trips refers to the percentage of the whole population who took at least one domestic tourism trip during the whole year.

The results of the 2019 Taiwan Tourism Condition Survey Report indicated that Taiwanese people made 169.28 million domestic toursim trips in 2019 (-1.06%). The Tourism Bureau encouraged locals to travel domestically in 2019 to revitalize domestic tourism amidst a weak overall ecomony. The Bureau introduced a "Spring Outing Project" and provided subisidies for an "Incentive Plan to Expand Fall and Winter Domestic Tourism." The number of domestic tourism visits fell 4.08% year over year (YoY) in the first half of 2019, but gained 3.42% in the second half. The Fourth quarter’s growth was the strongest at 6.15%.
Of the total number of domestic trips, 67.00% were weekend or holiday trips and 33.00% were weekday trips; about 88.50% of the domestic trips were self-planned, while tour agency arranged package tours accounting for 1.90%, and school, government, company, village, and other group travel contributed 9.60%. The main factors considered in choice of destinations were, in order of importance, ease of travel or convenience of connections, relaxation, leisure, and health, special events, curiosity to visit an unfamiliar place, and quality of food.
In 2019, average spending per person per tourism trip was NT$2,320 (up 5.31%). Spending on domestic tourism trips for the entire year is estimated at NT$392.7 billion (down 4.19%).
Visitor Trends At Major Tourism Attractions
Since 2001, the Tourism Bureau has collected statistics from subsidiary units on the number of visitors at major tourism and recreation attractions to understand visitor trends at these attractions as a reference for policy planning. The data for 2019 covered 326 attractions. Seventeen new sites were added and four were removed from the year before.
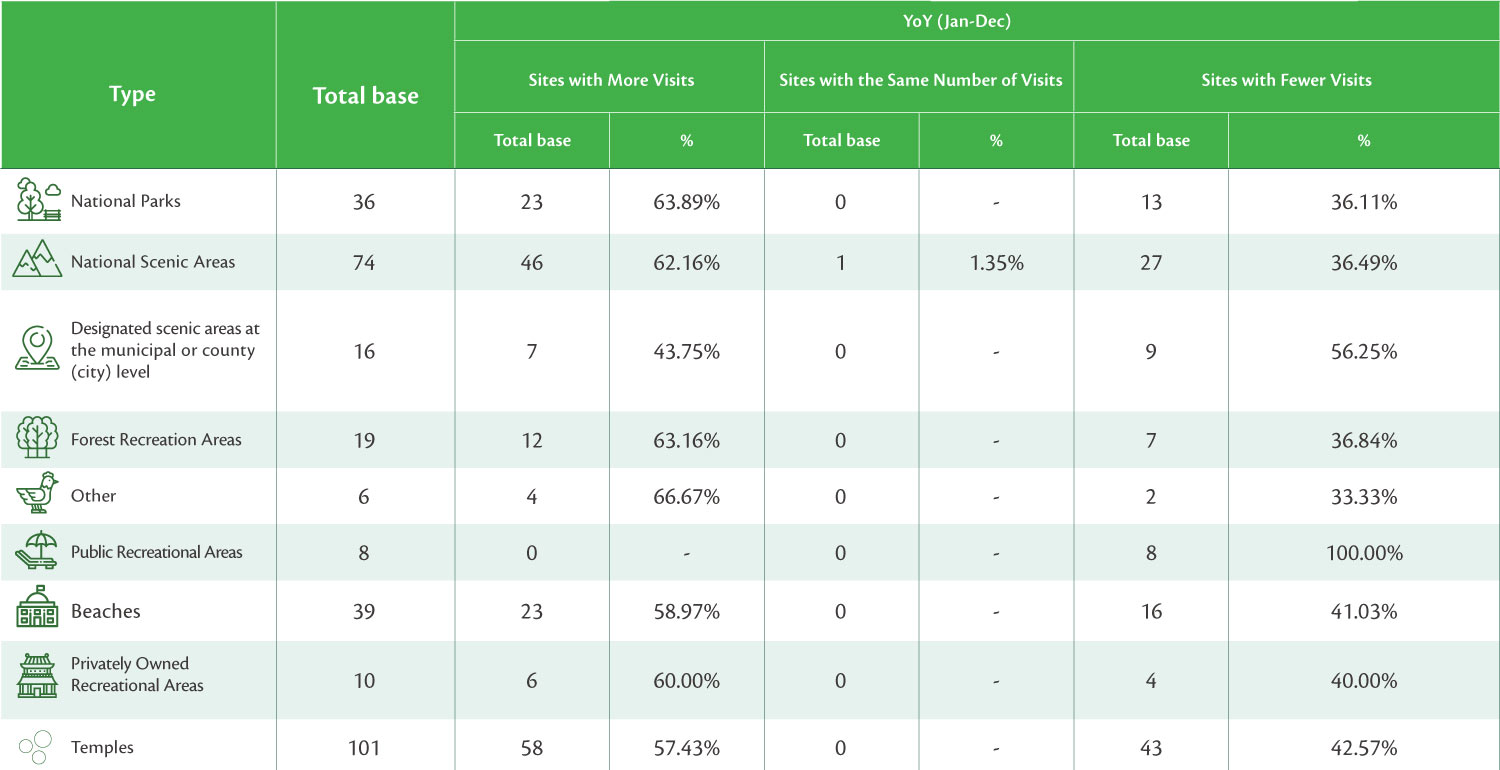
In terms of attraction type (excluding attractions added over the year), the number of visitors increased YoY at 60% of the national parks, national scenic areas, forest recreation areas, recreational farm areas, recreation farms, and religious sites; 50% of museums and other attractions; and about 40% of city and county level designated scenic areas. The number of visitors at all types of attractions fell YoY.
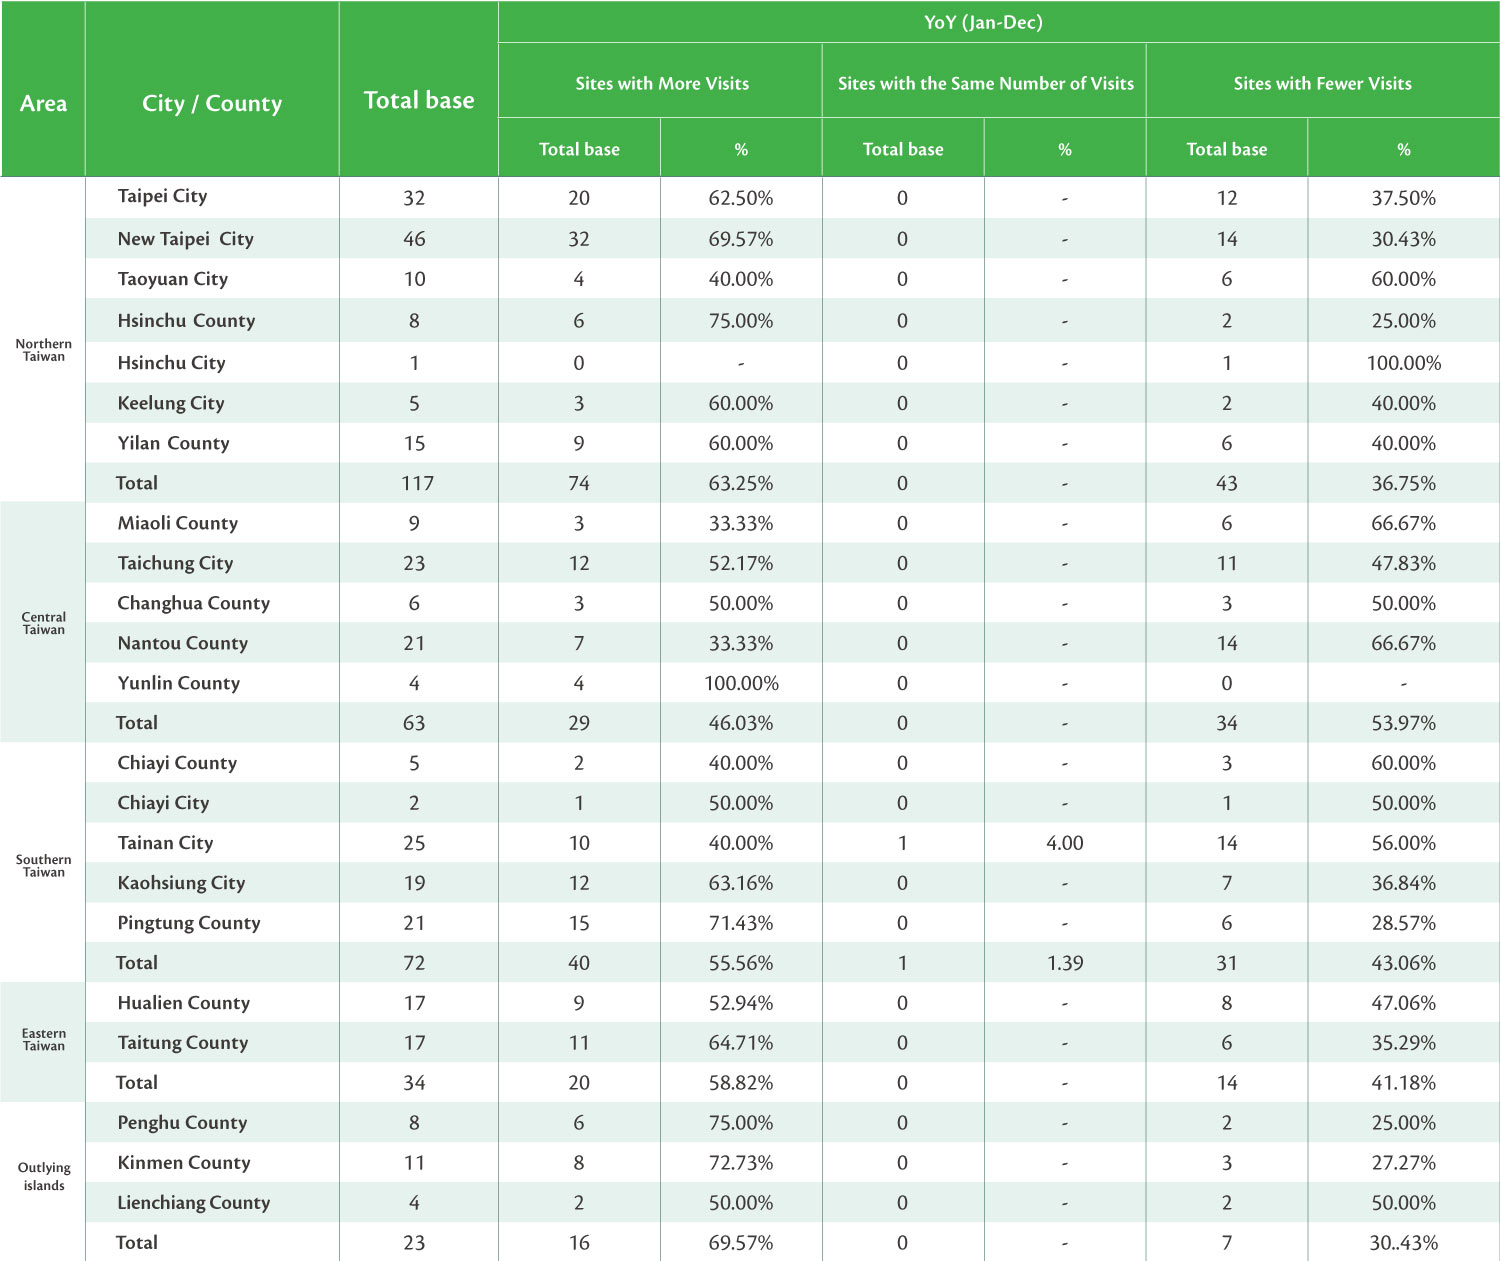
Major scenic spots in the central and southern regions saw the steepest falls in visitor numbers, while more than 60% of northern and outlying island destinations saw visitor increases.

Visitor Trends at Major Tourism and Recreation Attractions in Taiwan in 2019
Visitor Trends at Major Tourism and Recreation Attractions in Taiwan by County/City in 2019
 Good Morning Liyu Lake! Photo by Tai Ching-ming


